
SMART BUYER COMMUNITY™
Watch 2:14 to 2:30 for the footage of Lehman Brothers’ employees leaving recorded live
On September 15th 2008, Lehman Brothers had laid off a total of more than 25,000 employees on their collapse. That had shook the financial world as it is the first time that people and even the financial professionals witness that there is “nothing to big to fail”.
The number of gigantic bailouts, the toxicity of financial derivatives, the spiral effect of overly-packaged and promised investment vehicles…those are a few to name when it comes to what people remember about the Global Financial Crisis 2008/09.

Photo shot on the day of an employee packed and leaving their office, doesn’t seem too sad isn’t it
Well how is it relevant to Malaysia’s economic situation? As the name says “Global Financial Crisis”, it is a global meltdown.
In future articles I might cover in depth on what leads to the meltdown and what exactly happened during that time! Personally I think the movie “The Big Short (2015)” is a great way to understand how the housing market in the U.S collapse which lead to subprime mortgage and eventually, the Global Financial Crisis. But for now, let’s just stick to what is important to the article — The Timeline.
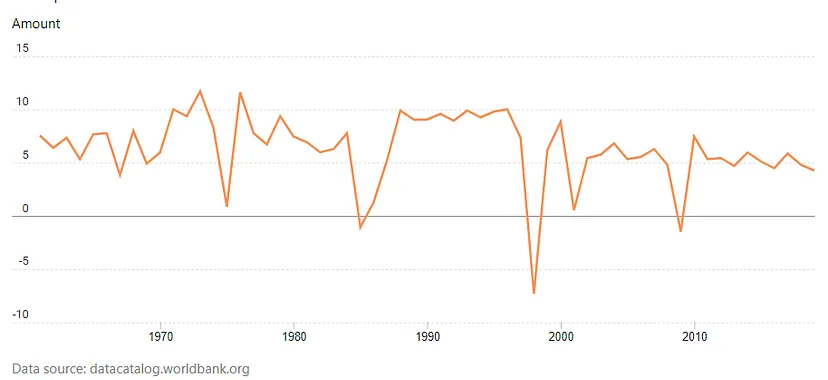
Pay Attention to the “Dips”
Along the timeline, noticed the trendline going below 0 (negative)—
those are the period when the crisis had happened.
The incidences:
i. Commodity Crisis 1985/1986
(Minor Dip, Shrinking Economy with slight negative growth rate)
ii. Asian Financial Crisis 1997/1998
(Major Dip, Shrinking Economy with extreme negative growth rate)
iii. Global Financial Crisis 2008/2009
(Obvious Dip, Shrinking Economy with negative growth rate around -1.5%)
So looking at these trendlines, what do they tell you? Below are some simple methods to look at what type of recovery a nation is experiencing, just by looking at chart!
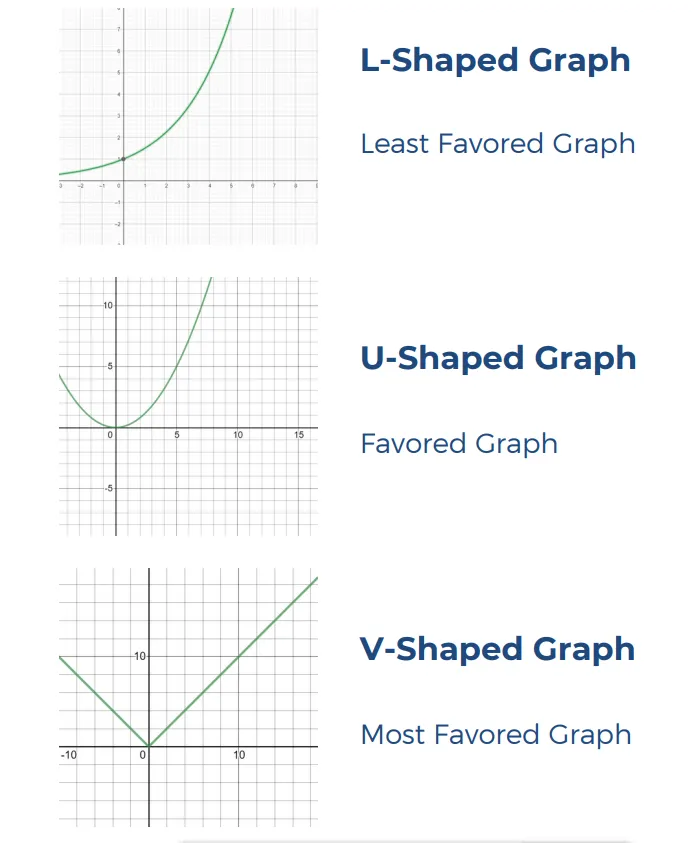
Type of shapes representing various recovery modes of an economy
Applying the above shapes, you might notice that on:
i. An U-Shaped Recovery for Commodity Crisis in 1985/86, signifying a steady and gradual recovery of the economy (normal recovery)
ii. A V-Shaped Recovery for Asian Financial Crisis in 1997/98, signifying a speedy and quick recovery of the economy (fast rebound recovery)
iii. Similarly, a V-Shaped Recovery for Global Financial Crisis in 2008/2009, signifying a speedy and quick recovery of the economy (fast rebound recovery). But also do take note that the state of Malaysian Economy is more resilient, as recorded with only -1.5% GDP growth despite global meltdown.
Well, just from simple chart analysis we can tell Malaysia’s economy is improving in terms of crisis resilience. However, that is true for Financial related Crisis. Lets look at how the recent performance of Covid-19 Pandemic Crisis
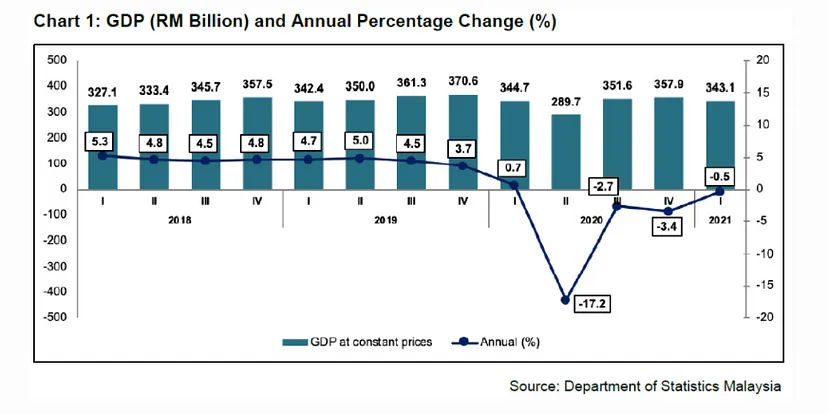
Latest data shows new record low on economic impact by Covid-19 Pandemic
From what we observed — Malaysia’s crisis resilience towards financial & economic disturbance has proved to be strong for the past few decades. But not a biological crisis, it is a new record low of -17.2% on GDP growth.
But still, did you notice the shape?
Although we still need time to look at more data, but it is going towards more to V-Shaped rather than U Shaped.
During these nearly 2 years of various MCO, plenty of business owners had felt the “revenge buying” behaviors and do felt the economy is running hot when there are not MCO imposed.
In my opinion, that means much of the economic interference and under-performed statistics are caused by lack of business activities and spending, instead of the decrease in demand just like any other crisis in the past.
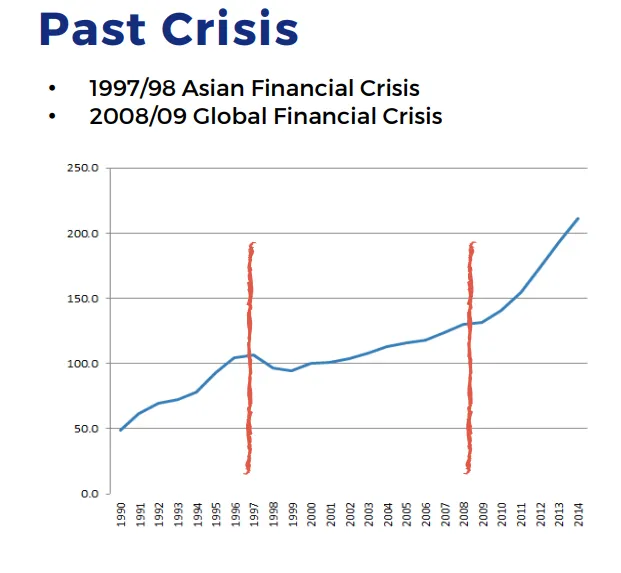
The two red lines represents Asian Financial Crisis (1st; left) and Global Financial Crisis (2nd; right)
Well, let us relate back to property prices! In the next article, I will break down statistically, what signifies a Property Bull Run, and how reliable are these studies and projection.
Hope this articles helps in these few aspects:
- Basic understanding of Historical Events like Global Financial Crisis (Lehman Brothers Collapse)
- Past Crisis Data and GDP Growth in Malaysia in recent decades
- Basic & Identifiable Shapes of Economy Recovery
- Personal Opinion of Economic Impacts on Different Crisis in Malaysia
Until then, stay safe & stay at home!
Catch up soon!